Information Security Lab 2 | Crack me
Information Security Lab 2 | Crack me

- Basic Setups
Let’s now play with a binary. In this lab, we have 4 binary files. Before you check these files, you have to make sure that you are in the VM environment.
$ vagrant ssh
$ seclab tut01
We can check these files by,
$ cd ~/tuts/lab01/tut01-crackme
$ ls
README  crackme0x00  crackme0x01  crackme0x02  crackme0x03
What are these files? Let’s try the first one crackme0x00 as an example. Suppose we run this executable file and enter the password 1234, we can not access it because the password is not correct.
$ ./crackme0x00
IOLI Crackme Level 0x00
Password: 1234
Invalid Password!
The question is that how can we bypass the password and get the file content? This is called to crack the file.
2. File Compilation
gdb or GNU Debugger (well, actually, we are going to use the PWN debugger because it is supported on the VM) is a command-line debugger meaning that you interact with it on the command line using text-based commands. It shares many similarities with debuggers you might have already used, and it also allows you to set breakpoints, step through your code, and see variable values.
To continue learning gdb , we will use the following code,
We can download this file by,
$ mkdir test
$ cd test
$ curl https://gist.githubusercontent.com/Sadamingh/219343e4905d8ff924e15444a8a8926d/raw/7b3a0d327fe720dbb52ed8032d555a6c717dcf75/gdb_example.c > gdb_example.c
Let’s see what will this code do. Let’s first compile it by using gcc,
$ gcc gdb_example.c
Then we can run the output binary file by,
$ ./a.out
This program will square an integer.
Useage:
         ./square number
Oops! It seems that this program is used to square an integer and we need to add an argument. Let’s try integer 4, and we can find out that the program squared this integer 4 and get an output of 16.
$ ./a.out 4
This program will square an integer.
4 squared is 16
To make gdb work correctly, we will use the following command to recompile the C script file,
$ gcc -g -Og gdb_example.c -o square
where,
-gmeans to produce debugging information in the operating system’s native format (stabs, COFF, XCOFF, or DWARF). GDB can work with this debugging information.-Ogmeans to optimize the debugging experience.-omeans where to place the primary output.
Then let’s run,
$ ./square 4
This program will square an integer.
4 squared is 16
We can find out that this has the same output as a.out file. Now, let’s try gdb on this file. By default, when we use gdb on our machine, we will be using pwndbg, which is a more advanced debugger than gdb.
$ gdb square
...
Reading symbols from square...done.
pwndbg>
3. PWN Debugger (pwndbg)
Now, let’s try the gdb. The first gdb command we are going to talk about is the list command, which is used to list specified functions or lines. We can directly list the lines without specifying anything,
pwndbg> l
Then this command will list the first 10 lines of our C code. If we try it again,
pwndbg> l
Then we are able to get the next 10 lines. Let’s try it two more times, we can find out the list command exceeds the total line number and we can not fetch more lines.
pwndbg> l
pwndbg> l
Line number 28 out of range; gdb_example.c has 27 lines.
To specify some lines of a function like main or square , we can directly specify the function name after the list command like,
pwndbg> l main
or,
pwndbg> l square
Another useful command is the info command that can be used to show the information of the current program. For example, we can check the current breakpoints by,
pwndbg> i b
or we can check the current stack by,
pwndbg> i s
or we can check the current registers by,
pwndbg> i r
Because we have no program running now, we are not expecting anything on the stack or registers, and also there should be no breaking points. We will check them later. However, we can check the functions in this program by,
pwndbg> i func
the output should be,
All defined functions:
File gdb_example.c:
int main(int, char **);
int square(int);
Non-debugging symbols:
0x0000000000000580  _init
0x00000000000005b0  puts@plt
0x00000000000005c0  strtol@plt
0x00000000000005d0  __printf_chk@plt
0x00000000000005e0  __cxa_finalize@plt
0x00000000000005f0  _start
0x0000000000000620  deregister_tm_clones
0x0000000000000660  register_tm_clones
0x00000000000006b0  __do_global_dtors_aux
0x00000000000006f0  frame_dummy
0x0000000000000770  __libc_csu_init
0x00000000000007e0  __libc_csu_fini
0x00000000000007e4  _fini
And we can find out that we have two functions in line 6 (main) and line 24 (square).
If we want to execute the program, we can use run command. If we directly type r as our command, we will get an error because we didn’t specify the argument of this function.
pwndbg> r
Starting program: /home/vagrant/test/square
ERROR: Could not find ELF base!
This program will square an integer.
Useage:
        ./square number
[Inferior 1 (process 3797) exited normally]
Instead, we can specify the argument by adding it after the r command like,
pwndbg> r 4
Starting program: /home/vagrant/test/square 4
This program will square an integer.
4 squared is 16
[Inferior 1 (process 3804) exited normally]
If we would like to make the program stop before it exits normally, we have to make some breakpoints and specify some locations. For example, we can make this program break at the function main,
pwndbg> b main
Breakpoint 1 at 0x555555554700: file gdb_example.c, line 6.
Or we can directly break at a line number (e.g. line 10),
pwndbg> b 10
Breakpoint 2 at 0x555555554717: file gdb_example.c, line 10.
If we have another file, we can break at that file by b filename:linenum , but we are not going to do this in the current program.
Now, let’s check all the breakpoints we have by info ,
pwndbg> i b
Num     Type           Disp Enb Address            What
1       breakpoint     keep y   0x0000555555554700 in main at gdb_example.c:6
2       breakpoint     keep y   0x0000555555554717 in main at gdb_example.c:10
To delete a breakpoint, we have to use the clear command. For example, if we want to delete the breakpoint at line 10, we have to use,
pwndbg> clear 10
Deleted breakpoint 2
Note that if we are in the line with a breakpoint we want to delete, we can directly use the clear command without specifying the line number. After that, we can use the info command to check the breakpoints now,
pwndbg> i b
Num     Type           Disp Enb Address            What
1       breakpoint     keep y   0x0000555555554700 in main at gdb_example.c:6
        breakpoint already hit 1 time
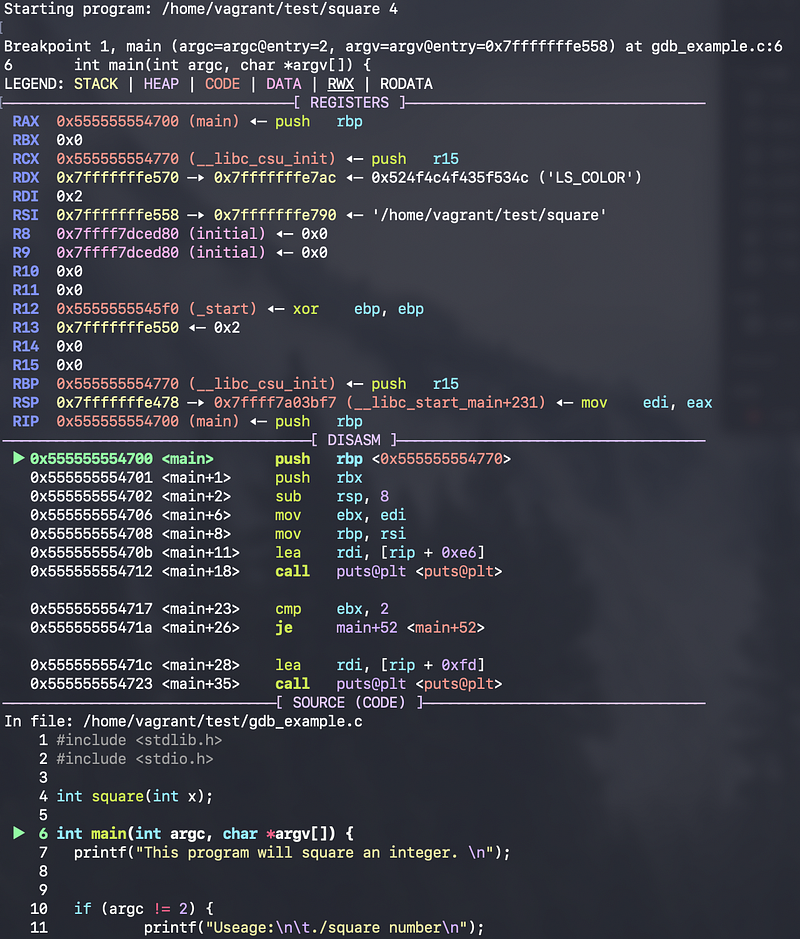
Okay, it seems like everything is okay. Now if we type r 4 again, we will stop the program at line 6 because this is our first breakpoint. Also, the PWN debugger is going to give us all the information about the register values, the disassembler instructions, the source code, the stack, and the backtrace information.
pwndbg> r 4

Now, after the breakpoint, we have two options to continue. We can use the next command to go to the next line in the code. But this command will not go into functions. If we run,
pwndbg> n
Then we will locate in line 7, which is the printf function. We can use the command where or bt (means backtrace, and this is commonly used) for checking our location,
pwndbg> bt
#0  main (argc=argc@entry=2, argv=argv@entry=0x7fffffffe548) at gdb_example.c:7
#1  0x00007ffff7a03bf7 in __libc_start_main (main=0x555555554700 <main>, argc=2, argv=0x7fffffffe548, init=<optimized out>, fini=<optimized out>, rtld_fini=<optimized out>, stack_end=0x7fffffffe538) at ../csu/libc-start.c:310
#2  0x000055555555461a in _start ()
If we run next command again, we will result in the next line of the current file, which would be line 10. However, we may want to go into the printf function to see what’s happening, and therefore, we can not use the next command. Instead, the step command will look into the functions. We can run,
pwndbg> s
printf (__fmt=<synthetic pointer>) at /usr/include/x86_64-linux-gnu/bits/stdio2.h:104
...
Again, we can check where we are located by bt command and the result shows that we are in line 104 of stdio2.h, because we step through the printf function.
pwndbg> bt
#0  printf (__fmt=<synthetic pointer>) at /usr/include/x86_64-linux-gnu/bits/stdio2.h:104
#1  main (argc=argc@entry=2, argv=argv@entry=0x7fffffffe548) at gdb_example.c:7
#2  0x00007ffff7a03bf7 in __libc_start_main (main=0x555555554700 <main>, argc=2, argv=0x7fffffffe548, init=<optimized out>, fini=<optimized out>, rtld_fini=<optimized out>, stack_end=0x7fffffffe538) at ../csu/libc-start.c:310
#3  0x000055555555461a in _start ()
If we want to jump out of this function and go back to the original binary file, we can use the finish command,
pwndbg> finish
And then if we check where we are, we will be fine in the gdb_example.c file,
pwndbg> bt
#0  main (argc=argc@entry=1, argv=argv@entry=0x7fffffffe568) at gdb_example.c:10
#1  0x00007ffff7a03bf7 in __libc_start_main (main=0x555555554700 <main>, argc=1, argv=0x7fffffffe568, init=<optimized out>, fini=<optimized out>, rtld_fini=<optimized out>, stack_end=0x7fffffffe558) at ../csu/libc-start.c:310
#2  0x000055555555461a in _start ()
So whenever you step in a function that is not yours, it may look a little scary but there’s nothing to be worried about because we can finish this function whenever we want.
Now, let’s add another breakpoint at line 17 and continue execution to that line,
pwndbg> b 17
pwndbg> c
...
► 17  int squaredNum = square(numToSquare);
...
In this line, we can try to print the value of the variable squaredNum and numToSquare by print command,
pwndbg> psquaredNum$1 = <optimized out>
pwndbg> pnumToSquare$2 = <optimized out>
<optimized out> means the compiler optimized the result of the output and we can not access the value of this variable at the current time. Then, let’s step to the next next line by,
pwndbg> s
pwndbg> s
...
  24 int square(int x) {
  25   int sq = x * x;
  26   return sq;
► 27 }
...
We can print the value of the sq variable by,
pwndbg> p sq
$3 = 16
If we try to print x, we will get,
pwndbg> p x
$4 = <optimized out>
If we want to print the value of squaredNum in this function, it will not be possible because we are already in the square function and we do not have this variable as a local variable.
pwndbg> p squaredNum
No symbol "squaredNum" in current context.
But it can be useful if we can read a variable of the parent function. The method to do so is by going up to the parent function by up command,
pwndbg> up
  f 0   0x5555555546fd square+3
► f 1   0x555555554751 main+81
  f 2   0x7ffff7a03bf7 __libc_start_main+231
Then we are able to print this variable because we can now access the stack of the parent function,
pwndbg> p squaredNum
$5 = <optimized out>
However, we can not access the variable sq because it is the child stack,
pwndbg> p sq
No symbol "sq" in current context.
We can use the down command to go back to the square function and then access the variable sq,
pwndbg> down
► f 0   0x5555555546fd square+3
  f 1   0x555555554751 main+81
  f 2   0x7ffff7a03bf7 __libc_start_main+231
Then, finally, we can print sq by,
pwndbg> p sq
$6 = 16
After debugging the code, we can quit the PWN debugger by quit command,
pwndbg> q
4. Crackme 0x00
Now, let’s go back to lab01 directory and see how we can crack these binary files,
$ cd /home/vagrant/tuts/lab01/tut01-crackme
$ ls
$ clear
Then, let’s look into the first binary file by PWN debugger,
$ gdb crackme0x00
$ r
And then we press ctrl+c when we have to type in the password. The program will then break at this place,
Starting program: /home/vagrant/tuts/lab01/tut01-crackme/crackme0x00
IOLI Crackme Level 0x00
Password: ^C
At this break, we can use bt command to see where we are in the program,
pwndbg> bt
#0  0xf7fd5079 in __kernel_vsyscall ()
#1  0xf7ecdd87 in __GI___libc_read (fd=0, buf=0x804b570, nbytes=1024) at ../sysdeps/unix/sysv/linux/read.c:27
#2  0xf7e5a318 in _IO_new_file_underflow (fp=<optimized out>) at fileops.c:531
#3  0xf7e5b43b in __GI__IO_default_uflow (fp=0xf7fbf5c0 <_IO_2_1_stdin_>) at genops.c:380
#4  0xf7e3ed41 in _IO_vfscanf_internal (s=<optimized out>, format=<optimized out>, argptr=<optimized out>, errp=<optimized out>) at vfscanf.c:630
#5  0xf7e49eb5 in __scanf (format=0x80487f1 "%s") at scanf.c:33
#6  0x080486d1 in main (argc=1, argv=0xffffd614) at crackme0x00.c:14
#7  0xf7dfff21 in __libc_start_main (main=0x80486a3 <main>, argc=1, argv=0xffffd614, init=0x8048720 <__libc_csu_init>, fini=0x8048780 <__libc_csu_fini>, rtld_fini=0xf7fe5970 <_dl_fini>, stack_end=0xffffd60c) at ../csu/libc-start.c:310
#8  0x08048512 in _start ()
This can be scary but the only relevant one to us is the #6 one,
#6 0x080486d1 in main (argc=1, argv=0xffffd614) at crackme0x00.c:14
And it shows us that we break crackme0x00.c at line 14 at the address 0x080486d1. Now, to see the code, we can first set a breakpoint at this location, run again, and then disassemble the code to find the password. To do so, we have to first add a new breakpoint,
pwndbg> b *0x080486d1
Then we run the program again. When we meet the password, we can type in some random numbers like 111111. After we press enter, the program will break at the breakpoint we have set,
Breakpoint 1, 0x080486d1 in main (argc=1, argv=0xffffd614) at crackme0x00.c:14
...
And now we can try to disassemble the binary by command disassemble,
pwndbg> disassemble
Dump of assembler code for function main:
   0x080486a3 <+0>: push   ebp
   0x080486a4 <+1>: mov    ebp,esp
   0x080486a6 <+3>: sub    esp,0x10
   0x080486a9 <+6>: push   0x80487f4
   0x080486ae <+11>: call   0x8048470 <puts@plt>
   0x080486b3 <+16>: add    esp,0x4
   0x080486b6 <+19>: push   0x804880c
   0x080486bb <+24>: call   0x8048430 <printf@plt>
   0x080486c0 <+29>: add    esp,0x4
   0x080486c3 <+32>: lea    eax,[ebp-0x10]
   0x080486c6 <+35>: push   eax
   0x080486c7 <+36>: push   0x80487f1
   0x080486cc <+41>: call   0x8048480 <scanf@plt>
=> 0x080486d1 <+46>: add    esp,0x8
   0x080486d4 <+49>: push   0x8048817
   0x080486d9 <+54>: lea    eax,[ebp-0x10]
   0x080486dc <+57>: push   eax
   0x080486dd <+58>: call   0x8048420 <strcmp@plt>
   0x080486e2 <+63>: add    esp,0x8
   0x080486e5 <+66>: test   eax,eax
   0x080486e7 <+68>: jne    0x8048705 <main+98>
   0x080486e9 <+70>: push   0x804881e
   0x080486ee <+75>: call   0x8048470 <puts@plt>
   0x080486f3 <+80>: add    esp,0x4
   0x080486f6 <+83>: push   0x804882d
   0x080486fb <+88>: call   0x80485f6 <print_key>
   0x08048700 <+93>: add    esp,0x4
   0x08048703 <+96>: jmp    0x8048712 <main+111>
   0x08048705 <+98>: push   0x804883c
   0x0804870a <+103>: call   0x8048470 <puts@plt>
   0x0804870f <+108>: add    esp,0x4
   0x08048712 <+111>: mov    eax,0x0
   0x08048717 <+116>: leave
   0x08048718 <+117>: ret
End of assembler dump.
A common sense is that, when we have some local data, we have to push it into the stack. So whenever we have a push instruction, we had better look into the code to see if there’s something related to the password. We can use the command x/1s to print the data in an address. Now, let’s see the first push instruction,
pwndbg> x/1s 0x80487f4
0x80487f4: "IOLI Crackme Level 0x00"
We can find out that this is the data of string “IOLI Crackme Level 0x00” and this is definitely not what we want to find.
A quicker way to find the password is that we can look into the functions and we can guess which function we will use to check the password. In the disassembled code, we can find out that whenever we call something, this means that we will have another function. These include,
0x080486ae <+11>: call   0x8048470 <puts@plt>
0x080486bb <+24>: call   0x8048430 <printf@plt>
0x080486cc <+41>: call   0x8048480 <scanf@plt>
0x080486dd <+58>: call   0x8048420 <strcmp@plt>
0x080486ee <+75>: call   0x8048470 <puts@plt>
0x080486fb <+88>: call   0x80485f6 <print_key>
0x0804870a <+103>: call   0x8048470 <puts@plt>
When we need to check the password, the most useful function of them is definitely the strcmp function in C, which is used to compare two strings. Before we call this function, we must prepare the arguments earlier. So we can find the password before this line. The latest one is the line,
0x080486d4 <+49>: push 0x8048817
And we can try to see what’s in the address 0x8048817 by,
pwndbg> x/1s 0x8048817
0x8048817: "250381"
Okay, seems like we have found our first password! Let’s try it in binary,
$ ./crackme0x00
IOLI Crackme Level 0x00
Password: 250381
Password OK :)
This is your flag:
F38FE749E36CD0437AD0062D6836C393618FCC4A412FDE666C89EB41AC0814D5
B734EBE71127B13BFE569599D6521FF424CEBDF34F07A91CF70B8CB12E324283
788E593AF6DED9DC41A86AB64EA9A7D9A2EF718EB8B6ACFEF7A195EF241649E1
E392715E0E0E936D46E3048A1AA22ADAD0874F6A25092B87D834E2E1E95E20AE
BE020DC6D44A858FA33063F6EDCE7AFFDB858583255CA09CFAC73D73E6AD8A9D
B284D6E905DCBE49D0E24D844B28CEE909A91515E97883A744A854BB60BB50A5
3AFE33A987FC897A39218C553951E87D2E5FEF0D312500DD936A9A0A2F59C450
                      >>> FOR TESTING  <<<
D4F31AC01E20589A6D7E1EE3026881F3B01F791B425198A9B0468B094C58797E
EC266EA25DE5EC175CB1E01B4E92830E6CDFA8FB36C8EC58B37B400D4F75B0F9
59CB724D7681B69F5D3A485F0DF03C23AB4B58D566D6849471554FEC5BB76D90
7DB098B8A60C23C81F41923CBF6CB3C23511C258A3BD04DB1FF697A7070E03E8
2747CB047C92E27232B4050A3B6D8A6E8377D939933AD921C6B14BA1FCD2BEA2
3199EC6E3C817041CD61B7B1394CAB1EBB01ACD74D4F1A7E857D22FDA227B834
2AF0AEC61229004D9E8CF6F4E3622419A37F6D410526951D6EB2F639DBEA49AD
Okay. Now, let’s continue to the next level.
5. Crackme 0x01
We can disassemble the code with the same procedure of the first binary,
$ gdb crackme0x01
pwndbg> r
...
Password: ^C
...
pwndbg> bt
pwndbg> b *0x080484b4
pwndbg> r
...
Password: 111111
...
pwndbg> disassemble
Then we can get the disassembled code,
Dump of assembler code for function main:
   0x08048486 <+0>:  push   ebp
   0x08048487 <+1>:  mov    ebp,esp
   0x08048489 <+3>:  sub    esp,0x4
   0x0804848c <+6>:  push   0x8048570
   0x08048491 <+11>: call   0x8048330 <puts@plt>
   0x08048496 <+16>: add    esp,0x4
   0x08048499 <+19>: push   0x8048588
   0x0804849e <+24>: call   0x8048320 <printf@plt>
   0x080484a3 <+29>: add    esp,0x4
   0x080484a6 <+32>: lea    eax,[ebp-0x4]
   0x080484a9 <+35>: push   eax
   0x080484aa <+36>: push   0x8048593
   0x080484af <+41>: call   0x8048340 <scanf@plt>
=> 0x080484b4 <+46>: add    esp,0x8
   0x080484b7 <+49>: mov    eax,DWORD PTR [ebp-0x4]
   0x080484ba <+52>: cmp    eax,0xc8e
   0x080484bf <+57>: jne    0x80484d0 <main+74>
   0x080484c1 <+59>: push   0x8048596
   0x080484c6 <+64>: call   0x8048330 <puts@plt>
   0x080484cb <+69>: add    esp,0x4
   0x080484ce <+72>: jmp    0x80484dd <main+87>
   0x080484d0 <+74>: push   0x80485a5
   0x080484d5 <+79>: call   0x8048330 <puts@plt>
   0x080484da <+84>: add    esp,0x4
   0x080484dd <+87>: mov    eax,0x0
   0x080484e2 <+92>: leave
   0x080484e3 <+93>: ret
End of assembler dump.
In the last binary, we find the strcmp function, but in this binary, we can not find a C function that is used to check the string. Instead, what we can find is a cmp instruction that can be used to make the decision of the branches. This instruction compares the value of the register eax and a hexadecimal 0xc8e. By reading the code after scanf, we can know that something is actually the string we type in and then we can guess something is our password, which is,
???? == ????Finally, let’s try this password for binary crackme0x01,
$ ./crackme0x01
IOLI Crackme Level 0x01
Password: ????
Password OK :)
6. Crackme 0x02
This binary has a similar structure of crackme0x01, but the disassembled code is,
pwndbg> disassemble
Dump of assembler code for function main:
   0x08048486 <+0>:  push   ebp
   0x08048487 <+1>:  mov    ebp,esp
   0x08048489 <+3>:  sub    esp,0x4
   0x0804848c <+6>:  push   0x8048570
   0x08048491 <+11>: call   0x8048330 <puts@plt>
   0x08048496 <+16>: add    esp,0x4
   0x08048499 <+19>: push   0x8048588
   0x0804849e <+24>: call   0x8048320 <printf@plt>
   0x080484a3 <+29>: add    esp,0x4
   0x080484a6 <+32>: lea    eax,[ebp-0x4]
   0x080484a9 <+35>: push   eax
   0x080484aa <+36>: push   0x8048593
   0x080484af <+41>: call   0x8048340 <scanf@plt>
=> 0x080484b4 <+46>: add    esp,0x8
   0x080484b7 <+49>: mov    eax,DWORD PTR [ebp-0x4]
   0x080484ba <+52>: imul   eax,eax,0x159
   0x080484c0 <+58>: cmp    eax,0x122c1c
   0x080484c5 <+63>: jne    0x80484d6 <main+80>
   0x080484c7 <+65>: push   0x8048596
   0x080484cc <+70>: call   0x8048330 <puts@plt>
   0x080484d1 <+75>: add    esp,0x4
   0x080484d4 <+78>: jmp    0x80484e3 <main+93>
   0x080484d6 <+80>: push   0x80485a5
   0x080484db <+85>: call   0x8048330 <puts@plt>
   0x080484e0 <+90>: add    esp,0x4
   0x080484e3 <+93>: mov    eax,0x0
   0x080484e8 <+98>: leave
   0x080484e9 <+99>: ret
End of assembler dump.
Again, we can find the cmp instruction here. But does the password equal 0x122c1c? Well, the answer is no! Because you can find out some calculations before this cmp instruction and the eax is not the value we read by scanf. Reading the data, we can know that the scanf value is multiplied by ???? and its result will be compared with ????. Therefore, we can calculate the password by,
???? / ???? == ???? == ????
Finally, let’s try this password for binary crackme0x02,
$ ./crackme0x02
IOLI Crackme Level 0x02
Password: ????
Password OK :)
7. Crackme 0x03
So finally, let’s play with the last one. The disassembled code is,
Dump of assembler code for function main:
   0x08048546 <+0>:  push   ebp
   0x08048547 <+1>:  mov    ebp,esp
   0x08048549 <+3>:  sub    esp,0x4
   0x0804854c <+6>:  push   0x8048638
   0x08048551 <+11>: call   0x8048350 <puts@plt>
   0x08048556 <+16>: add    esp,0x4
   0x08048559 <+19>: push   0x8048650
   0x0804855e <+24>: call   0x8048340 <printf@plt>
   0x08048563 <+29>: add    esp,0x4
   0x08048566 <+32>: lea    eax,[ebp-0x4]
   0x08048569 <+35>: push   eax
   0x0804856a <+36>: push   0x804865b
   0x0804856f <+41>: call   0x8048360 <scanf@plt>
=> 0x08048574 <+46>: add    esp,0x8
   0x08048577 <+49>: mov    eax,DWORD PTR [ebp-0x4]
   0x0804857a <+52>: push   0x52b23
   0x0804857f <+57>: push   eax
   0x08048580 <+58>: call   0x8048511 <test>
   0x08048585 <+63>: add    esp,0x8
   0x08048588 <+66>: mov    eax,0x0
   0x0804858d <+71>: leave
   0x0804858e <+72>: ret
End of assembler dump.
So now, in this case, we have no strcmp, and we also have no cmp instructions. What should we do? Note that we now have a new function called test and probably this is the function we will use to check the password. Let’s try to print the data before it. Of course, the eax will be the data we read from scanf , but what about something strange in the code? Actually, this is not an address and we can guess this is exactly the password we need,
???? == ????Finally, let’s try this password for binary crackme0x03,
$ ./crackme0x03
IOLI Crackme Level 0x03
Password: ????
Password OK!!! :)