Intro to Machine Learning 1 | Overview for Machine Learning, Review for Linear Regression and…
Intro to Machine Learning 1 | Overview for Machine Learning, Review for Linear Regression and Logistic Regression

- Overview
(1) Regressor Vs. Classifier
They are actually two sides of the same coin. If the target is numerical, the model is a regressor. If the target is categorical, the model is a classifier. Regressors draw through data, classifiers draw between clusters.
(2) Parameters and Hyperparameters
- Parameters: In machine learning, the parameters are part of the model, and they are actually the information we learned from the historical data.
- Hyperparameters: In machine learning, a hyperparameter is a parameter whose value is used to control the learning process. For example, the height of a decision tree, neighborhood number k in the KNN, the maximum number of trees in a random forest, minimum number of leaves in the tree, or learning rate.
In short, the model in machine learning is just an algorithm plus its parameters.
(3) Features and Feature Engineering
Good features are usually more important than the model. Suppose we have an audio markup project to distinguish between the audio spoken by a person about the word “Zero” and “No”. The word “Zero” has two syllables and “No” has only one syllable. So even if we have no real machine learning models, we can classify the audio of these two words based on the length.
Feature engineering focuses on synthesizing new features from existing features. And we have to remove the missing values as well. An example of this is the missing market sales data on holidays and Sundays.
(4) Metrics for Model Performance
- Training Data Set
- Testing Data Set
Suppose we have a midterm exam and if the professor gives the exact same questions before the exam, everyone can do pretty well. However, if the students are tested by some sort of new questions with the same structure, the students may not be able to have that good performance. That’s the reason why we typically split the training set and the testing set.
In python, we commonly do testing-training split by sklearn,
from sklearn.model_selection import train_test_split
X_train, X_test, y_train, y_test = train_test_split(X, y, test_size=0.2)
- Train, validate, test: these are some ways we can measure the performance of our project.
Let’s imagine an example of an unlucky prediction on the vehicles. The test set happens to be all the trucks, but the training set includes all the cars. Then probably we are going to conclude that we can not have a very good performance
(5) Simplified ML Process
- Understand the problem
- Acquire the data
- Split into train, validation, and test sets
- Sniff data, clean, deal with missing data
- Convert non-numeric features to numeric
- Repeat until satisfied: (1) Train a model using the training set and specific hyperparameters; (2) Tune model and do feature engineering with the validation set
- Assess model performance on a test set
2. Review of Linear Regression
(1) Reasons for Linear Models
- Simple, interpretable, super-fast, can’t be beaten for linear relationships
- Form the basis of neural networks
- etc.
(2) Linear Regression Notations
- Number Notations

- Vectors Notations

- Argument with 1 trick
n = X.shape[0]
B0 = np.ones(shape=(n, 1))
X = np.hstack([B0, X])
- Mean-squared Error

- Loss function: loss function calculate the cost we have after modeling the data. This means that we would like to minimize the loss function in an optimization problem. For linear regression, the loss function equals its mean squared error (MSE).

(3) Optimizing Linear Models
To minimize the value of the loss function, a popular approach is to minimize the gradient of the loss function. The gradient of the linear regression model is,

To minimize this gradient, we have to use an iteration approach called gradient descent. Each of the iteration steps should be regulated by the following recurrence relation,

where η is a scalar called learning rate that controls the magnitude of the step we take at each step t. We’re done optimizing when we find a β where all slopes are flat (or zero).

(4) Solving Linear Models by Python
lm = LinearRegression()
lm.fit(X_train, y_train)
# compute the R-square value on the testing set
print(lm.score(X_test, y_test))
# predict the values
print(lm.predict(X_new))
The score R-square for the linear regression will fluctuate if we have a relatively small data set. We can fix this problem by adding more data.
3. Review of Logistic Regression
(1) 1-Dimension Logistic Regression
Linear regression doesn’t work for discrete Y values and we will have really bad performance. One idea is to cut it off by some threshold, but this causes some discontinuity in the result. Finally, in practice, what we do is to use a Sigmoid(z) function so that we have a much better transition from class 0 to class 1.
def Sigmoid(z):
    return 1 / (1 + exp(-z))
(2) Logistic Regression Notations
- Sigmond Function

- Linear equation with Sigmond Function

- Log odds: this is something that can be proved based on the definition of the odds

- Log loss function: we would like to maximize the likelihood for logistic regression, and this means that we can also minimize the negative likelihood of it. So the loss function should be the negative log-likelihood.

(3) Optimizing Logistic Model Parameters
The gradient of the logistic model loss function is,

Based on our discussion, we can perform the gradient descend iteration
(4) Solving Logistic Models by Python
lg = LogisticRegression(solver = 'lbfgs', max_iter=1000)
lg.fit(X_train, y_train)      # regularization by default
# get the score of the model
lg.score(X_test, y_test)
# predict the probability for each category
lg.predict_proba(X_test, y_test)
# predict the result based on the highest probability
lg.predict(X_test, y_test)
4. Machine Learn Lab 1
(1) Basic Machine learning pipeline
- Get the data (SQL, Spark)
- Data Wrangling (standardization, imputing not available values)
- Feature analysis and engineering
- Model building, fitting, and selection
- Model Evaluation
- Productionize a model
(2) Dividing the Data Set
We are interested in generalization error not only the metrics we have for the model in case the overfitting and the underfitting. So we can basically test our models based on the validation set and the test set.
- Train set: part of the dataset used for training and to fit the model
- Validation set: part of the dataset used to select a specific model, we always use this to find the proper hyperparameter. The validation set is an independent dataset used to select models (complexity, tuning hyperparameters).
- Test set: part of the dataset used to estimate error
(3) Scaling Data
Sometimes we have multiple features and one or several of them may have a heavy tail. In this case, we may think about using a data scaler.

Basically, there are two kinds of scalers,
- Standard Scaler: it removes the mean and scaled to unit variance
- Min-Max Scaler: transforms each value to a given range. For example [0, 1]
Note that we have to deal with the outliers before we apply any scalers.
We have to think about scaling the data especially,
- When using linear models with regularization: Most are done otherwise regularization is unfair
- When using linear models without regularization: It is advisable because models converge faster
- When using neural networks
- When using nearest neighbor type algorithms (or anything with distances)
There are also some cases when the scaling is not necessary,
- Tree-based algorithms: for example, random forest and gradient boosting trees. These algorithms are also good at dealing with outliers.
(4) Example: Regularized Regression

(5) The Definition of Model Fitting
Fit the model means to minimize some formula result (e.g. the value of the loss function) or some parameters.
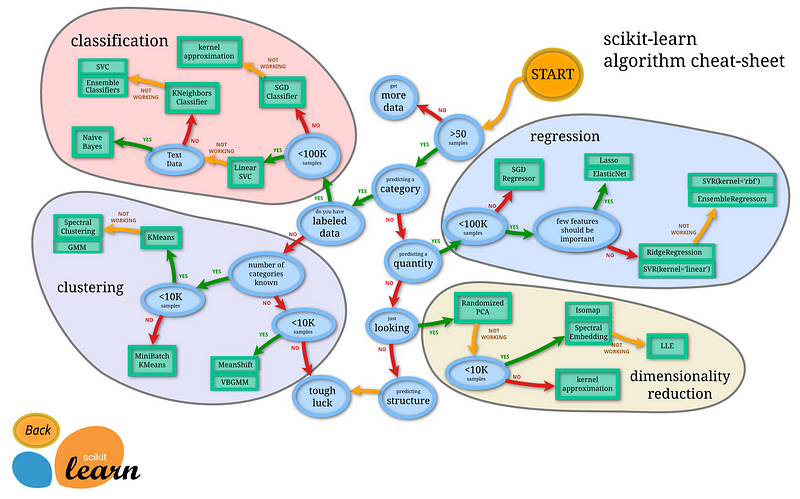
(6) Scikit-learn Package
Scikit-learn was initially developed by David Cournapeau as a Google summer of code project in 2007. The project now has more than 30 active contributors and has had paid sponsorship from INRIA, Google, Tinyclues, and the Python Software Foundation.