Intro to Machine Learning 10 | Lab Review
Intro to Machine Learning 10 | Lab Review

- Machine Learning Settings
(1) What are two supervised learning settings?
Ans: Classification and regression
(2) Briefly explain the train set, validation set, and test set.
Ans:
- train set: part of the dataset for training data
- validation set: part of the dataset for selecting models
- test set: part of the dataset for estimating error
(3) How to get a generalization error for a selected model?
Ans: By computing error on a large independent test set.
(4) Give three examples of hyperparameters.
Ans:
- Learning rate
- Depth of tree
- Number of clusters k
- etc.
(5) What are the two transforms of a standard scaler?
Ans:
- Zero out mean
- Scale to unit variance
(6) Suppose we have the following data after standard scaling, then what is the problem and what should be the solution?
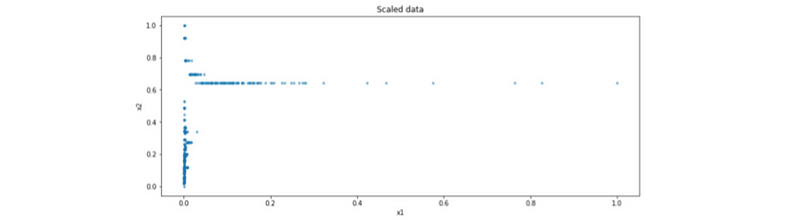
Ans:
- Problem: The feature x1 is heavy-tailed
- Solution: Log transformation before scaling
(7) Suppose we are given the train set X1, the validation set X2, and the test set X3. Then which dataset we should use for scaling each of these sets?
Ans: X1
(8) Give three types of models that we must scale data before modeling.
Ans:
- Linear models
- Neural networks
- Clustering (e.g. nearest neighbor type)
(9) When is scaling not necessary?
Ans:
- The data is initially scaled
- The model is tree-based
(10) What does it mean to fit a model?
Ans: Finding the model parameters that will minimize the loss function
2. Model Assessment and Selection
(1) What should we do for the train-test split instead of the train-validation-test split on model selection?
Ans: We should perform cross validation for the training set.
(2) When do we use cross-validation instead of train-validation split?
Ans: When the dataset is small.
(3) When do we use the time-based split?
Ans: When we have time-series data.
(4) What is the purpose of regularization?
Ans: Reduce overfitting.
(5) How many times of train-validation split should we perform in a LOOCV?
Ans: the number of observations.
(6) Suppose we have a 3-fold cross validation of 600 observations. Then what is the size of training data in each iteration?
Ans: 400
(7) When shall we use LOOCV or k-fold cross validation?
Ans:
- Estimating test error
- Model selection
(8) What happens if we used the same data for both model selection and assessment?
Ans: It will result in an optimistic estimate of the model’s error
(9) How can we select a model if we have an extremely small dataset?
Ans: Consider nested cross-validation.
(10) What is the difference between grid search and random search?
Ans:
- Random search is a subset of grid search used for a speed purpose
- They are commonly as accurate
(11) How to get a confidence interval for model error if we have a small dataset?
Ans: Bootstrapping M times for error estimates
(12) Why do we have to scale inside the cross-validation loop?
Ans: Because we have to use the real training data to find the scaling parameters
(13) Why we must scale the data for regularization?
Ans: Because otherwise, the regularization will be unfair
3. Encoding and Feature Engineering
(1) Why dropping columns is not a recommended solution for missing values?
Ans: Because it loses information.
(2) Why do imputation and adding a column for missing values work?
Ans: Because these values may not miss at random.
(3) Given three imputation techniques.
Ans:
- Use mean or median for numerical data
- Use the most common value for categorical data
- Use prediction by fitting the model with the imputed variable as the target
- etc.
(4) What is the definition of normal outliers?
Ans: They are data points
> 1.5 * IQR + Q3 or < Q1 - 1.5 * IQR
(5) Why outliers can be a problem?
Ans: They can have an effect on models
(6) What are the solutions for outliers?
Ans:
- Dropping
- Imputing
- Capping
(7) Let’s say we have a feature with a variance of 0.003. When should we exclude it in the model?
Ans: When we have linear models or neural networks. (Or when we have non-tree-based models.)
(8) What are the different ways in which we can encode categorical variables? When do you use them?
Ans: One hot encoding and the hashing trick are used for logistic regression, regression, and neural networks while label encoding can be used for any tree-based algorithm like random forest or gradient boosting.
(9) Why the SGDClassifier function is faster than LogisticRegression?
Ans: Because LogisticRegression uses all the data to compute one step of gradient descent while SGDClassifier uses just one observation.
4. Losses and Metrics
(1) When do we use MAE instead of MSE?
Ans: when we have outliers
(2) When do we use RMSE instead of MAE?
Ans: When we want a higher weight/punishment for large errors.
(3) Define the cross-entropy loss that is often used with neural networks based classifiers.
a) Write the expression for binary classification problems.
b) Write the expression for multi-class classification problems
Ans:
a)

b)

(4) Suppose we have an email with the true label Ham. However, the soft prediction of this email is (Ham, Spam) = (0.3, 0.7). Then what is the log loss in this prediction?
Ans:
# Suppose Ham = 1 and Spam = 0
logloss = -(log0.3) = log3.33
# Suppose Ham = 0 and Spam = 1
logloss = -(log0.7) = log(10/7)
(8) Suppose we classify pictures in classes Piazza, Cake, and Cookie and we have the following three soft predictions,
- Pred = (0.2, 0.1, 0.7), True = (0, 0, 1)
- Pred = (0.1, 0.5, 0.4), True = (0, 0, 1)
- Pred = (0.6, 0.2, 0.2), True = (1, 0, 0)
Compute the entire logloss for these predictions.
Ans: We only need to care about the prediction with true value 1
logloss = (-log0.7 - log0.4 - log0.6) / 3
(9) Suppose we classify pictures in labels Mountain, Lake, and Forest and we have the following three soft predictions,
- Pred = (0.9, 0.7, 0.7), True = (1, 0, 1)
- Pred = (0.1, 0.6, 0.7), True = (0, 1, 1)
- Pred = (0.7, 0.9, 0.5), True = (1, 1, 1)
Compute the entire logloss for these predictions.
Ans: We have to flip the label to all ones,
- Pred = (0.9, 0.3, 0.7), True = (1, 1, 1)
- Pred = (0.9, 0.6, 0.7), True = (1, 1, 1)
- Pred = (0.7, 0.9, 0.5), True = (1, 1, 1)
Then we can calculate the log-loss by,
logloss = (-log0.9 - log0.3 - log0.7
           -log0.9 - log0.6 - log0.7
           -log0.7 - log0.9 - log0.5) / 3
(10) Suppose we have the following soft predictions,
pred   0.0    0.7    0.4     0.3     0.1     0.6     0.8     0.2
y       0      1      0       1       1       1       0       0
a) What is the confusion matrix if the threshold is 0.3?
b) What should be the sensitivity, precision, accuracy, false-positive rate when the threshold is 0.3?
c) What should be the F1 score and Fβ score when the threshold is 0.3 and β is 2?
d) Compute the AUC score.
e) With the threshold from 0.1, 0.3, 0.5, 0.9, draw a ROC curve, calculate AUROC.
f) With the threshold from 0.1, 0.3, 0.5, 0.9, draw a PR curve, calculate AUPRC.
Ans: The hard prediction is,
hard 0 1 1 1 0 1 1 0
Then,
TP = 3
TN = 2
FP = 2
FN = 1
Then the confusion matrix should be,
+------------------+------------------+
|                  |                  |
|                  |                  |
|        2         |         2        |   0
|                  |                  |
|                  |                  |
+------------------+------------------+       True
|                  |                  |
|                  |                  |
|        1         |         3        |   1
|                  |                  |
|                  |                  |
+------------------+------------------+
         0                   1
                Predict
b) We have,
sensitivity = 3/4 = 0.75
precision = 3/5 = 0.6
accuracy = 5/8 = 0.625
false-positive rate = 2/4 = 0.5
c) We have,
F1 = 2 * 1 / (1/0.6 + 1/0.75) = 2/3
Fβ = (1+4) * 0.6 * 0.75 / (4 * 0.6 + 0.75)
   = 2.25 / 3.15 = 0.71
d) Sort it then,
pred   0.0    0.1    0.2     0.3     0.4     0.6     0.7     0.8
y       0      1      0       1       0       1       1       0
In total, we have the number of pairs as,
# of pairs = 4 * 4 = 16
Misordered pairs should be,
# of misordered pairs = 7
So the AUC should be,
AUC = # of ordered pairs / # of pairs = 9/16
e) The FPRs and TPRs for each threshold are
threshold                 FPR                    TPR
0.9                       0.00                   0.00
0.5                       0.25                   0.50
0.3                       0.50                   0.75
0.1                       0.75                   1.00
Then the ROC curve is,
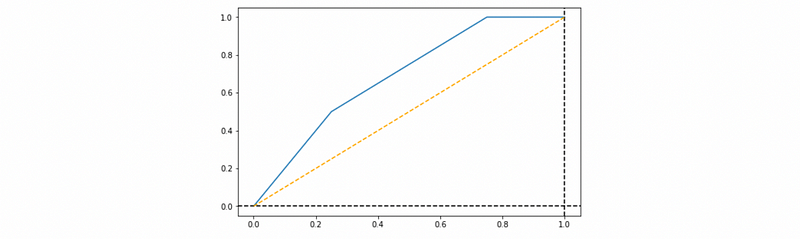
The AUROC score is 0.6875.
f) The recalls and precisions for each threshold are
threshold               recall                 precision
0.9                     0.00                   1.00
0.5                     0.50                   0.67
0.3                     0.75                   0.60
0.1                     1.00                   0.57

The AUPRC score is 0.7217.
5. Bias and Variance
(1) Explain underfitting and overfitting.
Ans:
- Underfitting: model is not able to capture the relationship between the input and the target
- Overfitting: model learns details and noise of the training data to the extent that negatively impacts the performance of new data
(2) What’s the meaning of model complexity?
Ans:
- Number of features and parameters
- Linear or non-linear model
- Amount of regularization
(3) How to decrease bias?
Ans:
- Increase parameters
- Increase complexity
- Decrease regularization
(4) How to decrease variance?
Ans:
- Decrease parameters
- Decrease model complexity
- Increase regularization
(5) Consider the following kNN model. What’s wrong and how we can modify this model?

Ans:
- This model is overfitting with high variance and low bias
- We can improve this model by increasing k
(6) What is the effect of increasing the regularization parameter?
Ans:
- Increase the bias
- Decrease the variance
(7) Which one has a higher bias, a shallow decision tree or a fully grown decision tree?
Ans: a shallow decision tree
(8) How does bagging work for the random forest model?
Ans:
- RF uses fully grown decision trees which is low bias, high variance
- Bagging reduces variance by averaging the bootstrap samples
(9) Which one is more likely to overfit, a high variance model or a high bias model?
Ans: The high variance model
(10) Which one is more likely to underfit, a high variance model or a high bias model?
Ans: The high bias model
6. Imbalanced Data
(1) What is the definition of an imbalanced dataset?
Ans: Datasets where the positive class has far fewer observations than the negative class.
(2) What are the downsides of random undersampling?
Ans:
- examples are removed independently on how useful they can be
- useful information may be deleted
(3) Give three techniques of undersampling.
Ans:
- Condensed Nearest Neighbor (CNN)
- One-Side Selection
- Edited Nearest Neighbor (ENN)
- etc.
(4) Name two techniques of oversampling.
Ans:
- Random sampling
- SMOTE
(5) Why we should not use accuracy for measuring imbalanced data?
Ans: Since it does not distinguish between the numbers of correctly classified examples of different classes, it may lead to erroneous conclusions.
(6) Why we should not use ROC-AUC for measuring imbalanced data?
Ans: ROC-AUC can present an overly optimistic view of an algorithm’s performance if there is class imbalance.