Linear Regression 4 | SLR Prediction and Diagnosis of SLR Model
Linear Regression 4 | SLR Prediction and Diagnosis of the SLR Model
- SLR Point Prediction and Intervals
(1) The Definition of Point Prediction
Suppose we are given x = x0, and by the definition of the fitted value,

then the point prediction of SLR is defined by,

(2) The Expectation of Point Prediction
The expectation of the point prediction is given by,

Proof:

then,

By unbias estimators of OLS,

Also, because we can know that,

Thus, we can say that the point prediction is an unbiased estimator of,

(3) The Bias of the Point Prediction
The Bias of the point prediction is,

Proof:
As it is defined,

then,
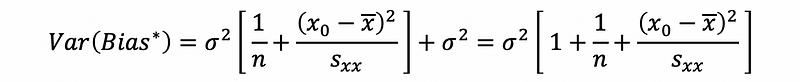
(4) The Variance of the Bias of Point Prediction
The variance of the bias of the point prediction is,

Proof:

then,

then,

then,

then,

then,

then,

then,

then,

then,

then,

By the fact that,

then,

thus,

By the fact that,

then,
We can also have another method of proof, see the proof of the variance of fitted value in the following article,
Series: Linear Regressionmedium.com
Note that when σ² is unknown, we can then estimate it by MSE,

(5) The Confidence Interval of Point Prediction
Because we have known that the distribution of the expectation of y when x=x0 is,

then, the 100(1-α)% CI of the expectation of the point prediction is,

(6) The Definition of the Actual Bias
The actual bias of the point prediction is defined by,

(7) The Variance of the Actual Bias
The variance of actual bias of the point prediction is,

Proof:

then,

then, it is also we have (here all the covariances are zeros),

then,
(8) The Predication Interval of Point Prediction
Because we have known that the distribution of y (not the expectation) when x=x0 is,

then, the 100(1-α)% confidence interval of y given x0 (which is also called the predication interval) is,

2. Diagnosis of SLR Model
How we can know if SLR is a proper model to use? We can check the dataset by doing plots and try to find out if they match our basic assumptions for SLR.
(1) Assumptions of SLR (LINE Assumptions)
- Linearity: The relationship between x and y must be linear
- Independence of errors: the error terms must be independent to every term in the SLR (including the other error terms)
- Normally Distributed: We strongly assumed that the error terms are identically independently distributed to the normal distribution N(0, σ²).
- Equal variance: We assumed that the error terms have the same constant variance σ²
(2) Diagnosis Plot Tools
- Scatter Plot of x and y: show the relationship between x and y
- Residual Plot of ei and fitted values yi-cap
- Auto-Correlation Plot of the residual (for example, ei and time-ordered objectives, Commonly used in time series analysis)
- Quantile-Quantile Plot (QQ Plot) of ei
We are going to explain more of them in the following parts.
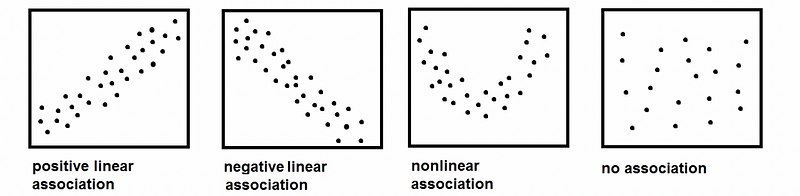
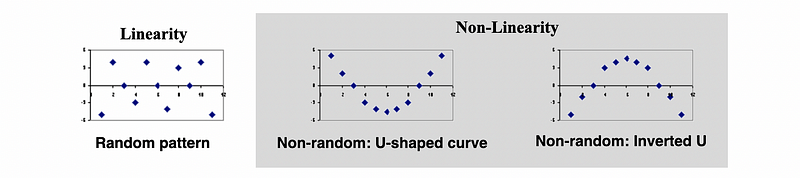
(3) Linearity Diagnosis
We use the Scatter Plot and Residual Plot to see the linearity.
For the scatter plot, we can have,
For the residual plot, we can have,
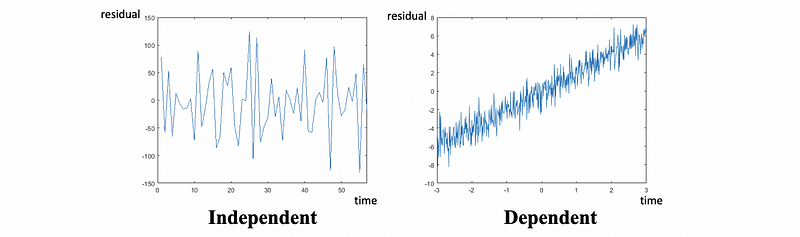
(4) Independence Diagnosis
We use the Residual Plot and Auto-Correlation Plot to see the independence of the errors.
For the residual plot, we can have,

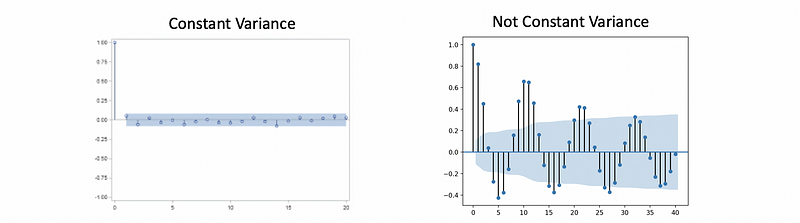
For Auto-Correlation Plot,
(5) Constant Variance Diagnosis
We use the Residual Plot to see the constant variance.
(6) Normality Diagnosis
We use the QQ Plot to see the constant variance.
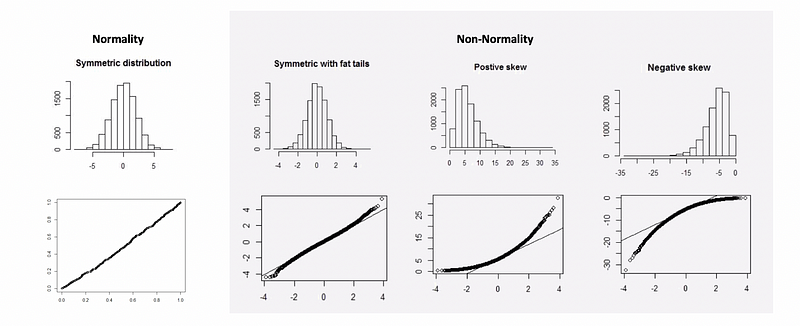
Note that the residual plot and the QQ plot are the most important polts to look at when examining the assumptions of the SLR. Make sure we have the proper plots for our further analysis.