Probability and Statistics 10 | The Cheatsheet for Distributions, the Statistical Inference, and…
Probability and Statistics 10 | The Cheatsheet for Distributions, the Statistical Inference, and the Confidence Interval

- Discrete Distribution
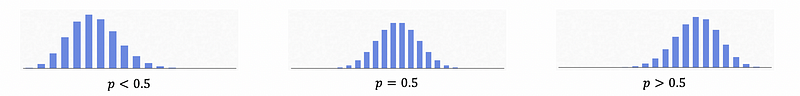
(1) Binomial Distribution
- Notation

- PMF

- Mean

- Variance

- Graph
(2) Geometric Distribution I
- Concept
Random variable X is the number of failures before the 1st success
- Notation

- PMF

- Mean

- Variance

- Graph

(3) Geometric Distribution II
- Concept
Random variable X is the trial on which the 1st success occurs.
- Notation
- PMF

- Mean
- Variance
- Graph
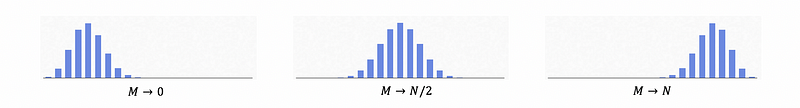
(4) Hypergeometric Distribution
- Concept
Random variable X is the number of successes in the sample.
- Notation

- PMF

- Mean

- Variance

- Graph

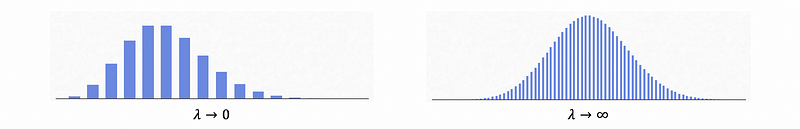
(5) Poisson Distribution
- Notation

- PMF

- Mean

- Variance

- Graph
2. Continuous Distributions
(1) Exponential Distribution
- Notation


- Mean

- Variance

- Graph

(2) Normal Distribution
- Notation


- Mean

- Variance

- Graph

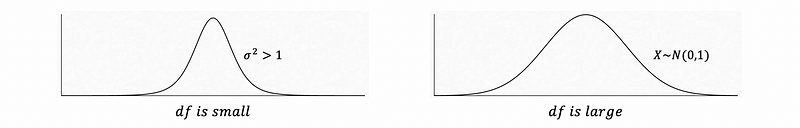
(3) Student’s t Distribution
- Notation


- Mean

- Variance

- Graph
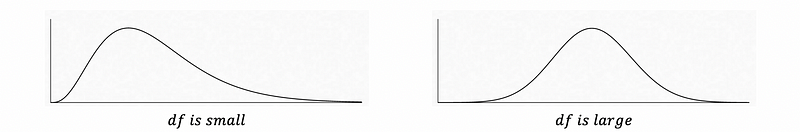
(4) Chi-Square Distribution
- Notation


- Mean

- Variance

- Graph
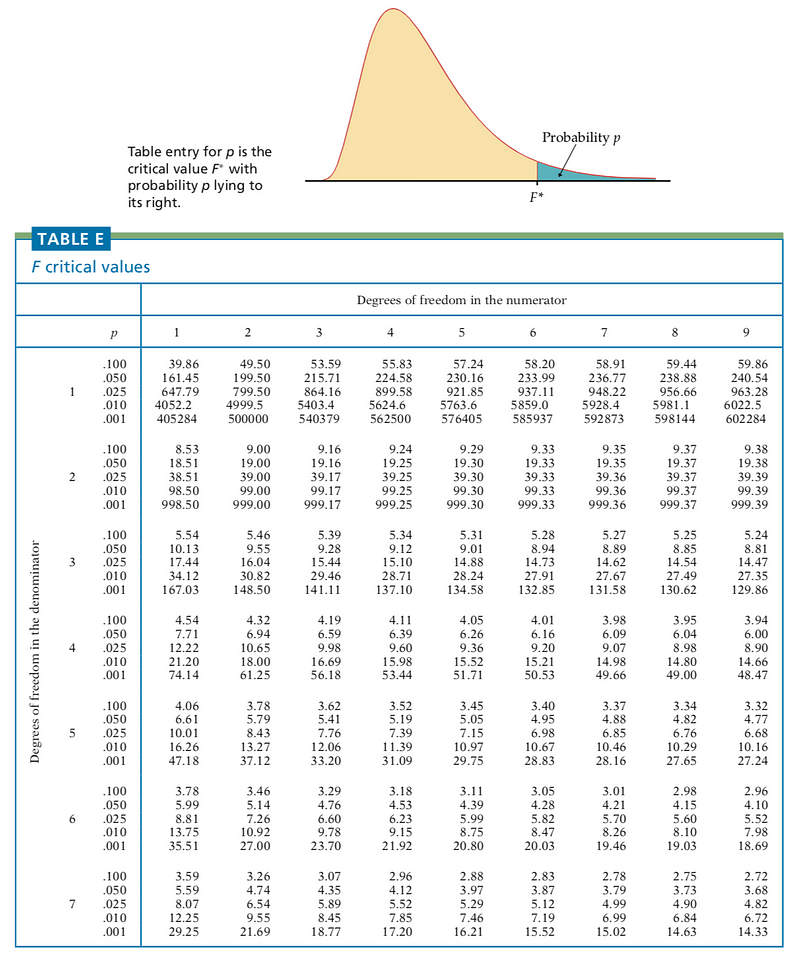
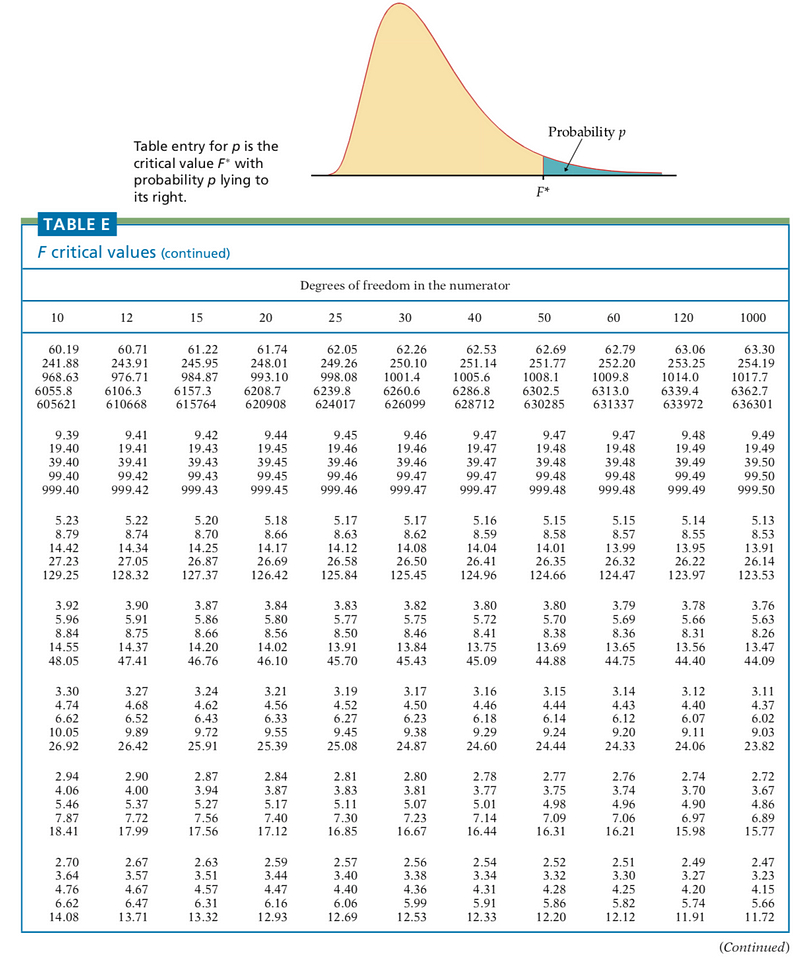
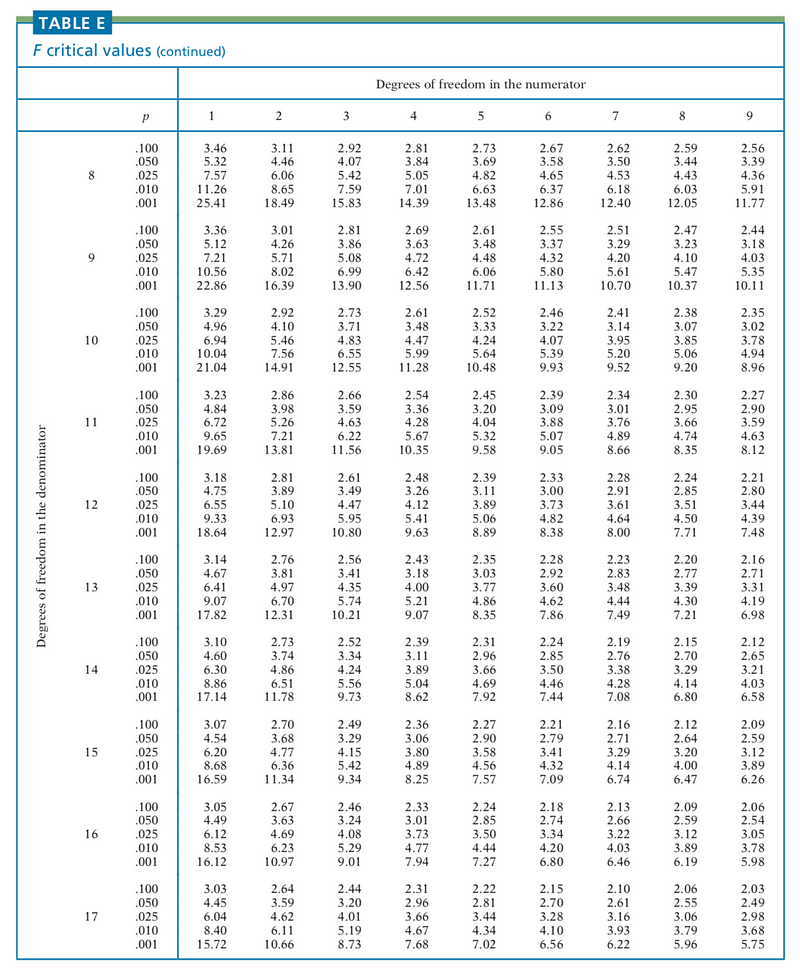
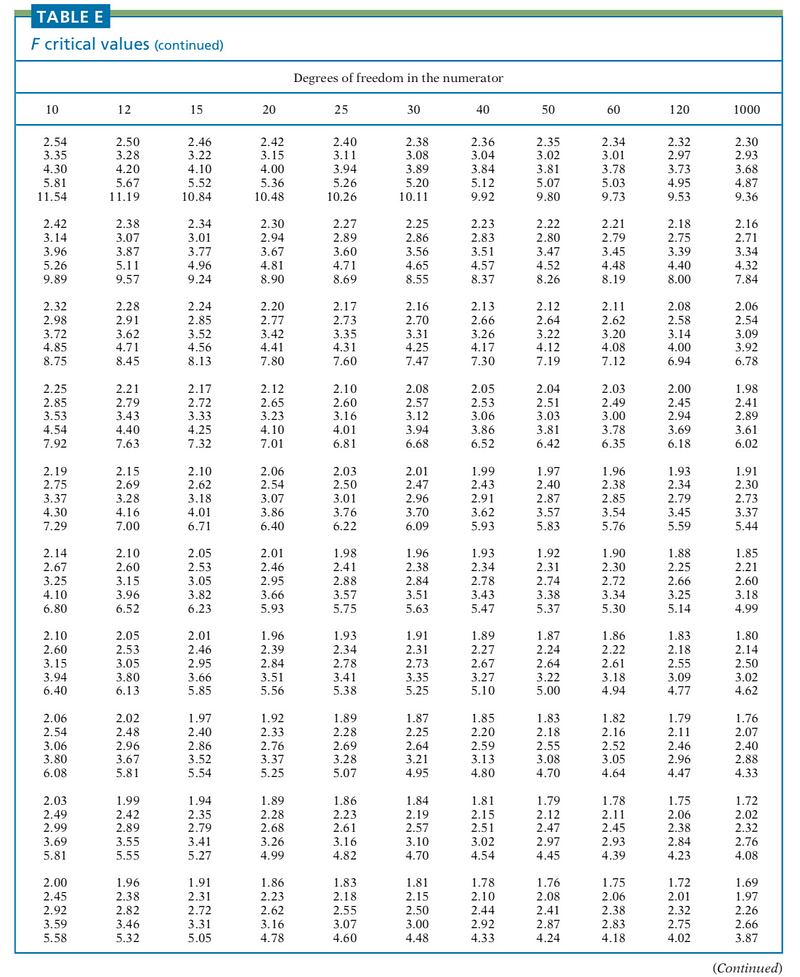
(5) F Distribution
Note: F distribution is very dirty and ugly, so we are not going to state it here, just leave it for future discussions (if possible).
3. Statistical Inference
(1) One-Sample Mean with σ known: Z-Test

(2) One-Sample Mean with σ unknown: T-Test


(3) Two-Sample Difference of Means with σ1 = σ2: Paired T-Test with Pooled Variance


(4) Two-Sample Difference of Means with σ1 ≠ σ2: Paired T-Test with Satterthwaite Degree of Freedom


(5) One-Sample Proportion: Z-Test (De Moivre-La Place Theorem)

(6) Two-Sample Difference of Proportions: Z-Test (De Moivre-La Place Theorem)


(7) One-Sample Correlation Coefficient: Z-Test with the Fisher Transformation


(8) Two-Sample Difference of Correlation Coefficient: Z-Test with the Fisher Transformation

(9) One-Sample Variance: χ² Test

(10) Two-Sample Variances Ratio: F-Test

4. Confidence Interval
(1) One-Sample Mean with σ known

(2) One-Sample Mean with σ unknown

(3) Two-Sample Difference of Means with σ1 = σ2

(4) Two-Sample Difference of Means with σ1 ≠ σ2

(5) One-Sample Proportion

(6) Two-Sample Difference of Proportions (Note this is different from the hypothesis test)

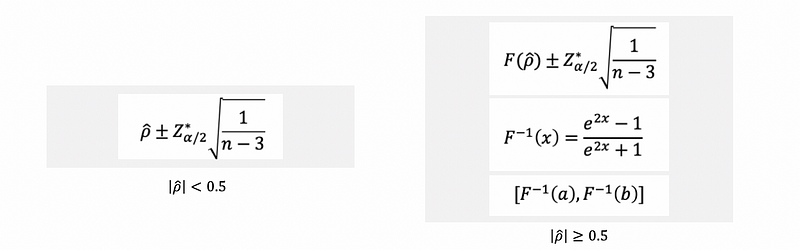
(7) One-Sample Correlation Coefficient
(8) Two-Sample Difference of Correlation Coefficient


(9) One-Sample Variance

(10) Two-Sample Variances Ratio

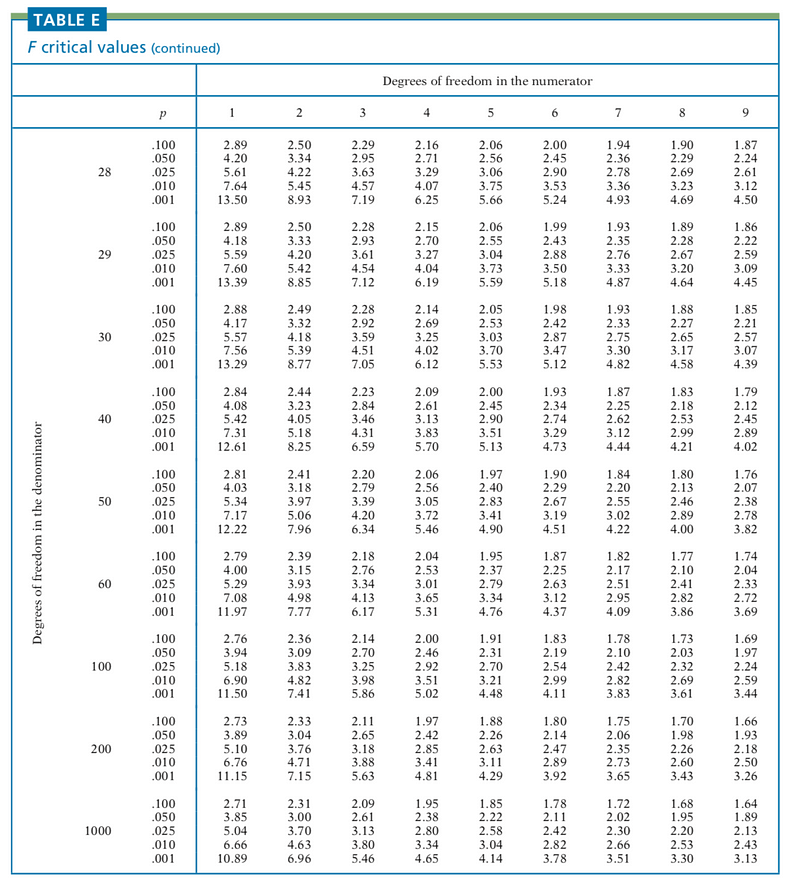
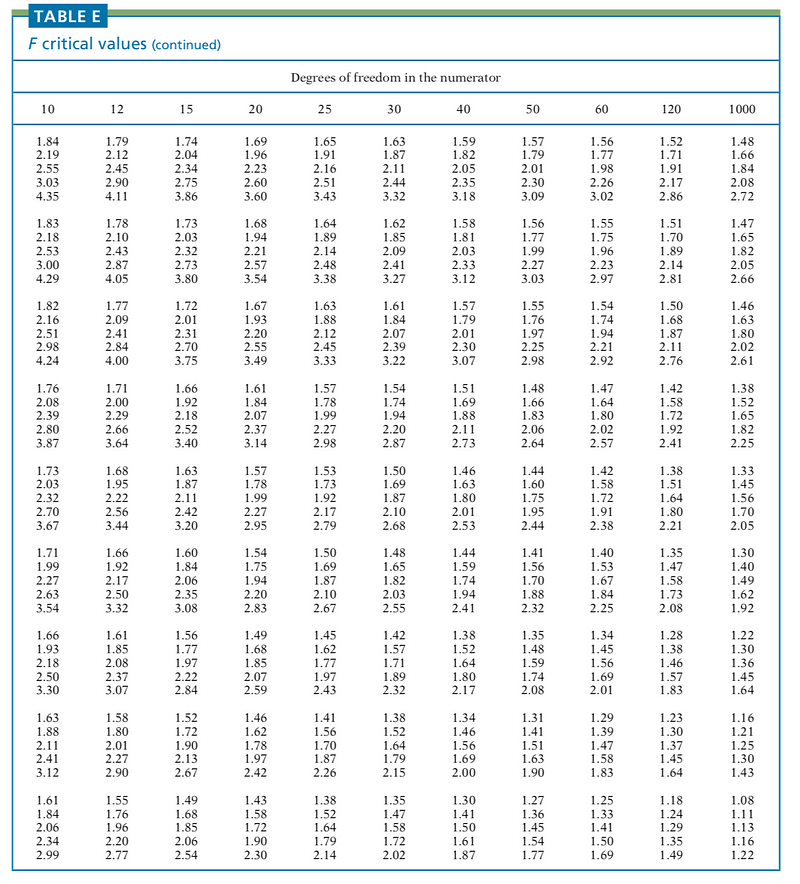
5. Statistical Distribution Table
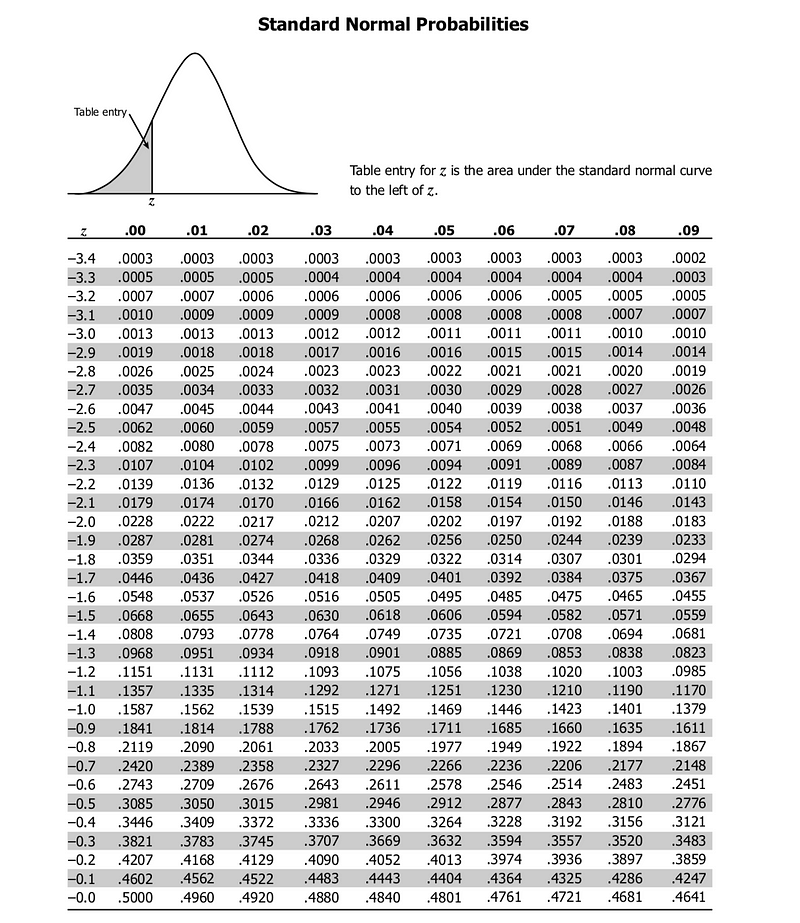
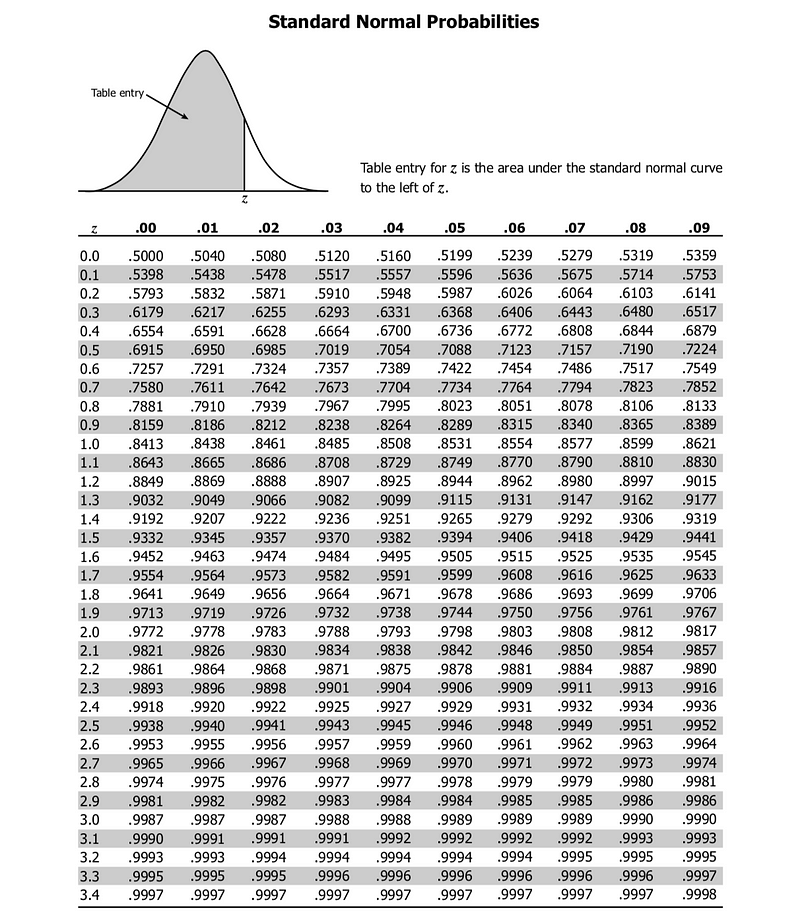
(1) Standard Normal Distribution Table
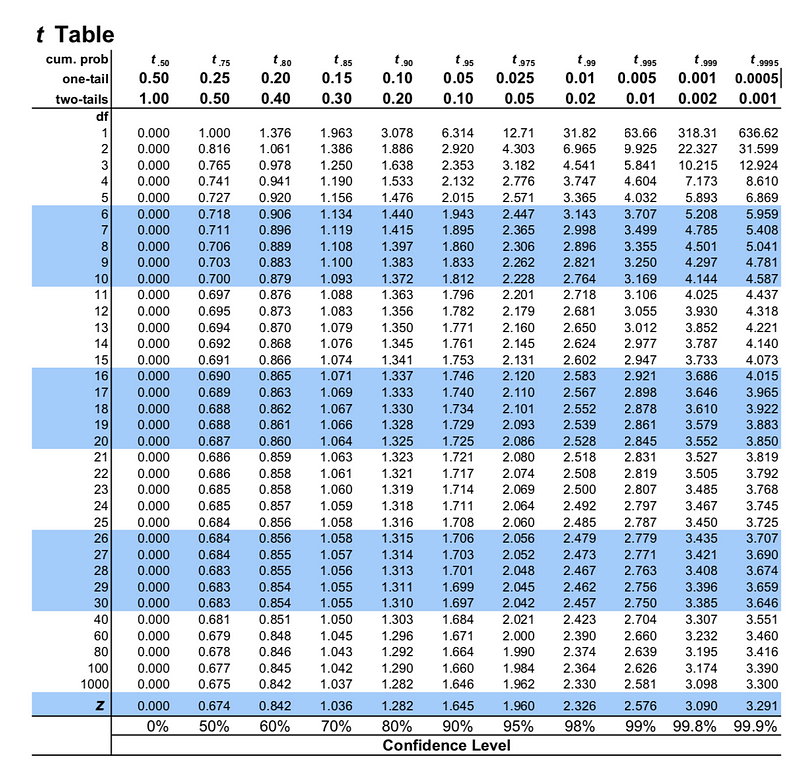
(2) Student’s t Distribution Table
(3) Chi-Square Distribution Table

(4) F Distribution Table